Index Trend Analysis Report
Prepared for you on Thursday, May 8, 2025.
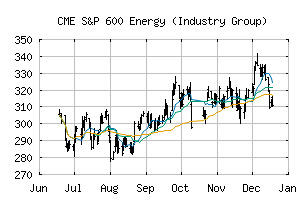
S&P 600 Energy (Industry Group) (CME:SP600-1010)
Bull Market Weakness (+75) - SP600-1010 is showing signs of short-term weakness, but still remains in the confines of a long-term uptrend. Keep an eye on SP600-1010 as it may be in the beginning stages of a reversal.
Is it time to buy, sell, or avoid SP600-1010?
MarketClub looks at technical strength and momentum to determine if the timing is right for SP600-1010.
Learn more about the Trade Triangles and how we make technical analysis as easy as buy and sell.
|
|||||||||||||||
|
|||||||||||||||
MarketClub’s Trade Triangles for SP600-1010
![]() The long-term trend has been DOWN since Jun 7th, 2024 at 379.68
The long-term trend has been DOWN since Jun 7th, 2024 at 379.68
![]() The intermediate-term trend has been UP since May 2nd, 2025 at 267.03
The intermediate-term trend has been UP since May 2nd, 2025 at 267.03
![]() The short-term trend has been UP since May 8th, 2025 at 265.24
The short-term trend has been UP since May 8th, 2025 at 265.24
Smart Scan Analysis for SP600-1010
Based on our trend formula, SP600-1010 is rated as a +70 on a scale from -100 (Strong Downtrend) to +100 (Strong Uptrend).
| Open | High | Low | Price | Change |
|---|---|---|---|---|
| 265.53 | 270.63 | 262.45 | 268.97 | +6.59 |
| Prev. Close | Volume | Bid | Ask | Time |
| 262.38 | 66824906 | 2025-05-08 16:19:11 |
| 52wk High | 681.82 | 52wk High Date | 2018-05-22 |
| 52wk Low | 414.57 | 52wk Low Date | 2018-11-28 |