Index Trend Analysis Report
Prepared for you on Friday, April 19, 2024.
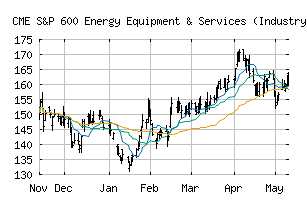
S&P 600 Energy Equipment & Services (Industry) (CME:SP600-101010)
Sidelines Mode (-55) - SP600-101010 is moving in a sideways pattern and is unable to gain momentum in either direction. Beware of choppy movement and consider a sidelines position until a stronger trend is identified.
Is it time to buy, sell, or avoid SP600-101010?
MarketClub looks at technical strength and momentum to determine if the timing is right for SP600-101010.
Learn more about the Trade Triangles and how we make technical analysis as easy as buy and sell.
|
|||||||||||||||
|
|||||||||||||||
MarketClub’s Trade Triangles for SP600-101010
![]() The long-term trend has been UP since Mar 8th, 2024 at 155.78
The long-term trend has been UP since Mar 8th, 2024 at 155.78
![]() The intermediate-term trend has been DOWN since Apr 16th, 2024 at 157.74
The intermediate-term trend has been DOWN since Apr 16th, 2024 at 157.74
![]() The short-term trend has been UP since Apr 12th, 2024 at 169.58
The short-term trend has been UP since Apr 12th, 2024 at 169.58
Smart Scan Analysis for SP600-101010
Based on our trend formula, SP600-101010 is rated as a -55 on a scale from -100 (Strong Downtrend) to +100 (Strong Uptrend).
| Open | High | Low | Price | Change |
|---|---|---|---|---|
| 158.46 | 160.80 | 156.78 | 157.54 | +1.22 |
| Prev. Close | Volume | Bid | Ask | Time |
| 157.54 | 24402446 | 2024-04-18 16:19:41 |
| 52wk High | 443.26 | 52wk High Date | 2018-01-12 |
| 52wk Low | 279.13 | 52wk Low Date | 2018-11-28 |