Index Trend Analysis Report
Prepared for you on Thursday, December 26, 2024.
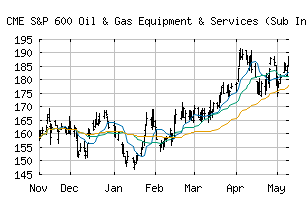
S&P 600 Oil & Gas Equipment & Services (Sub Ind) (CME:SP600-10101020)
Countertrend Down (-85) - SP600-10101020 is showing short-term strength. However, look for the longer-term bearish trend to resume. As always, continue to monitor the trend score and set stops.
Is it time to buy, sell, or avoid SP600-10101020?
MarketClub looks at technical strength and momentum to determine if the timing is right for SP600-10101020.
Learn more about the Trade Triangles and how we make technical analysis as easy as buy and sell.
|
|||||||||||||||
|
|||||||||||||||
MarketClub’s Trade Triangles for SP600-10101020
![]() The long-term trend has been DOWN since Aug 5th, 2024 at 171.27
The long-term trend has been DOWN since Aug 5th, 2024 at 171.27
![]() The intermediate-term trend has been DOWN since Dec 17th, 2024 at 169.98
The intermediate-term trend has been DOWN since Dec 17th, 2024 at 169.98
![]() The short-term trend has been UP since Dec 26th, 2024 at 165.93
The short-term trend has been UP since Dec 26th, 2024 at 165.93
Smart Scan Analysis for SP600-10101020
Based on our trend formula, SP600-10101020 is rated as a -85 on a scale from -100 (Strong Downtrend) to +100 (Strong Uptrend).
| Open | High | Low | Price | Change |
|---|---|---|---|---|
| 165.84 | 166.56 | 163.06 | 166.03 | +0.25 |
| Prev. Close | Volume | Bid | Ask | Time |
| 165.78 | 3538740 | 2024-12-26 14:58:26 |
| 52wk High | 428.31 | 52wk High Date | 2018-01-25 |
| 52wk Low | 261.42 | 52wk Low Date | 2018-11-28 |