Index Trend Analysis Report
Prepared for you on Monday, March 16, 2026.
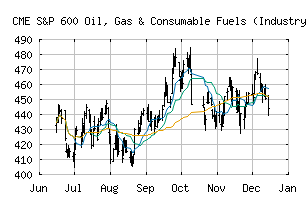
S&P 600 Oil, Gas & Consumable Fuels (Industry) (CME:SP600-101020)
Strong Uptrend (+100) - SP600-101020 is in a strong uptrend that is likely to continue. With short-term, intermediate, and long-term bullish momentum, SP600-101020 continues to climb. Traders should protect gains and look for a change in score to suggest a slow down in momentum.
Is it time to buy, sell, or avoid SP600-101020?
MarketClub looks at technical strength and momentum to determine if the timing is right for SP600-101020.
Learn more about the Trade Triangles and how we make technical analysis as easy as buy and sell.
|
|||||||||||||||
|
|||||||||||||||
MarketClub’s Trade Triangles for SP600-101020
![]() The long-term trend has been UP since Jun 13th, 2025 at 430.40
The long-term trend has been UP since Jun 13th, 2025 at 430.40
![]() The intermediate-term trend has been UP since Jan 5th, 2026 at 452.73
The intermediate-term trend has been UP since Jan 5th, 2026 at 452.73
![]() The short-term trend has been UP since Mar 12th, 2026 at 558.34
The short-term trend has been UP since Mar 12th, 2026 at 558.34
Smart Scan Analysis for SP600-101020
Based on our trend formula, SP600-101020 is rated as a +100 on a scale from -100 (Strong Downtrend) to +100 (Strong Uptrend).
| Open | High | Low | Price | Change |
|---|---|---|---|---|
| 550.20 | 557.28 | 547.13 | 556.84 | +2.14 |
| Prev. Close | Volume | Bid | Ask | Time |
| 556.84 | 29531158 | 2026-03-13 16:19:26 |
| 52wk High | 735.77 | 52wk High Date | 2018-05-22 |
| 52wk Low | 419.9 | 52wk Low Date | 2018-11-28 |