Index Trend Analysis Report
Prepared for you on Wednesday, July 30, 2025.
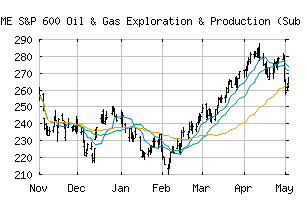
S&P 600 Oil & Gas Exploration & Production (Sub Ind) (CME:SP600-10102020)
Crossroads (+60) - SP600-10102020 is struggling to move into a solid trend. Beware of choppy markets and consider a sidelines position until a stronger trend is identified.
Is it time to buy, sell, or avoid SP600-10102020?
MarketClub looks at technical strength and momentum to determine if the timing is right for SP600-10102020.
Learn more about the Trade Triangles and how we make technical analysis as easy as buy and sell.
|
|||||||||||||||
|
|||||||||||||||
MarketClub’s Trade Triangles for SP600-10102020
![]() The long-term trend has been DOWN since Feb 25th, 2025 at 229.52
The long-term trend has been DOWN since Feb 25th, 2025 at 229.52
![]() The intermediate-term trend has been UP since Jul 28th, 2025 at 214.29
The intermediate-term trend has been UP since Jul 28th, 2025 at 214.29
![]() The short-term trend has been UP since Jul 24th, 2025 at 206.17
The short-term trend has been UP since Jul 24th, 2025 at 206.17
Smart Scan Analysis for SP600-10102020
Based on our trend formula, SP600-10102020 is rated as a +60 on a scale from -100 (Strong Downtrend) to +100 (Strong Uptrend).
| Open | High | Low | Price | Change |
|---|---|---|---|---|
| 215.33 | 216.14 | 211.37 | 214.80 | +0.47 |
| Prev. Close | Volume | Bid | Ask | Time |
| 214.80 | 15114947 | 2025-07-29 16:17:56 |
| 52wk High | 459.11 | 52wk High Date | 2018-07-10 |
| 52wk Low | 228.28 | 52wk Low Date | 2018-11-28 |