Index Trend Analysis Report
Prepared for you on Saturday, March 14, 2026.
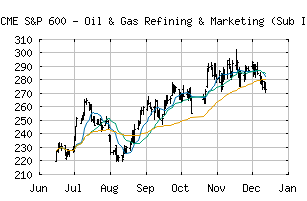
S&P 600 - Oil & Gas Refining & Marketing (Sub Ind) (CME:SP600-10102030)
Strong Uptrend (+100) - SP600-10102030 is in a strong uptrend that is likely to continue. With short-term, intermediate, and long-term bullish momentum, SP600-10102030 continues to climb. Traders should protect gains and look for a change in score to suggest a slow down in momentum.
Is it time to buy, sell, or avoid SP600-10102030?
MarketClub looks at technical strength and momentum to determine if the timing is right for SP600-10102030.
Learn more about the Trade Triangles and how we make technical analysis as easy as buy and sell.
|
|||||||||||||||
|
|||||||||||||||
MarketClub’s Trade Triangles for SP600-10102030
![]() The long-term trend has been UP since Mar 4th, 2026 at 293.99
The long-term trend has been UP since Mar 4th, 2026 at 293.99
![]() The intermediate-term trend has been UP since Jan 13th, 2026 at 263.52
The intermediate-term trend has been UP since Jan 13th, 2026 at 263.52
![]() The short-term trend has been UP since Mar 11th, 2026 at 300.30
The short-term trend has been UP since Mar 11th, 2026 at 300.30
Smart Scan Analysis for SP600-10102030
Based on our trend formula, SP600-10102030 is rated as a +100 on a scale from -100 (Strong Downtrend) to +100 (Strong Uptrend).
| Open | High | Low | Price | Change |
|---|---|---|---|---|
| 304.28 | 311.96 | 302.35 | 308.90 | +1.78 |
| Prev. Close | Volume | Bid | Ask | Time |
| 308.90 | 2945351 | 2026-03-13 16:19:26 |
| 52wk High | 139.4 | 52wk High Date | 2018-10-18 |
| 52wk Low | 99.14 | 52wk Low Date | 2018-04-02 |