Index Trend Analysis Report
Prepared for you on Friday, July 26, 2024.
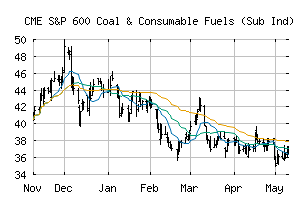
S&P 600 Coal & Consumable Fuels (Sub Ind) (CME:SP600-10102050)
Crossroads (-60) - SP600-10102050 is struggling to move into a solid trend. Beware of choppy markets and consider a sidelines position until a stronger trend is identified.
Is it time to buy, sell, or avoid SP600-10102050?
MarketClub looks at technical strength and momentum to determine if the timing is right for SP600-10102050.
Learn more about the Trade Triangles and how we make technical analysis as easy as buy and sell.
|
|||||||||||||||
|
|||||||||||||||
MarketClub’s Trade Triangles for SP600-10102050
![]() The long-term trend has been UP since Jun 3rd, 2024 at 43.18
The long-term trend has been UP since Jun 3rd, 2024 at 43.18
![]() The intermediate-term trend has been DOWN since Jul 23rd, 2024 at 39.21
The intermediate-term trend has been DOWN since Jul 23rd, 2024 at 39.21
![]() The short-term trend has been DOWN since Jul 18th, 2024 at 40.62
The short-term trend has been DOWN since Jul 18th, 2024 at 40.62
Smart Scan Analysis for SP600-10102050
Based on our trend formula, SP600-10102050 is rated as a -60 on a scale from -100 (Strong Downtrend) to +100 (Strong Uptrend).
| Open | High | Low | Price | Change |
|---|---|---|---|---|
| 38.86 | 39.38 | 38.63 | 39.35 | +0.85 |
| Prev. Close | Volume | Bid | Ask | Time |
| 38.50 | 1632778 | 2024-07-26 16:19:56 |
| 52wk High | 24.34 | 52wk High Date | 2018-06-04 |
| 52wk Low | 13.17 | 52wk Low Date | 2017-12-05 |