Index Trend Analysis Report
Prepared for you on Monday, December 8, 2025.
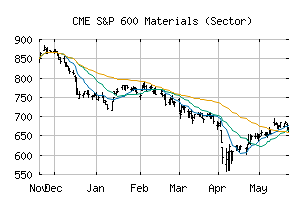
S&P 600 Materials (Sector) (CME:SP600-15)
Bull Market Weakness (+75) - SP600-15 is showing signs of short-term weakness, but still remains in the confines of a long-term uptrend. Keep an eye on SP600-15 as it may be in the beginning stages of a reversal.
Is it time to buy, sell, or avoid SP600-15?
MarketClub looks at technical strength and momentum to determine if the timing is right for SP600-15.
Learn more about the Trade Triangles and how we make technical analysis as easy as buy and sell.
|
|||||||||||||||
|
|||||||||||||||
MarketClub’s Trade Triangles for SP600-15
![]() The long-term trend has been UP since Jul 1st, 2025 at 719.07
The long-term trend has been UP since Jul 1st, 2025 at 719.07
![]() The intermediate-term trend has been UP since Nov 26th, 2025 at 804.21
The intermediate-term trend has been UP since Nov 26th, 2025 at 804.21
![]() The short-term trend has been DOWN since Dec 8th, 2025 at 812.91
The short-term trend has been DOWN since Dec 8th, 2025 at 812.91
Smart Scan Analysis for SP600-15
Based on our trend formula, SP600-15 is rated as a +75 on a scale from -100 (Strong Downtrend) to +100 (Strong Uptrend).
| Open | High | Low | Price | Change |
|---|---|---|---|---|
| 817.37 | 818.60 | 798.33 | 798.86 | -17.71 |
| Prev. Close | Volume | Bid | Ask | Time |
| 816.57 | 40980395 | 2025-12-08 16:59:37 |
| 52wk High | 578.79 | 52wk High Date | 2018-09-21 |
| 52wk Low | 453.75 | 52wk Low Date | 2018-11-28 |