Index Trend Analysis Report
Prepared for you on Saturday, April 18, 2026.
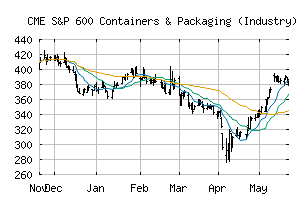
S&P 600 Containers & Packaging (Industry) (CME:SP600-151030)
Crossroads (+60) - SP600-151030 is struggling to move into a solid trend. Beware of choppy markets and consider a sidelines position until a stronger trend is identified.
Is it time to buy, sell, or avoid SP600-151030?
MarketClub looks at technical strength and momentum to determine if the timing is right for SP600-151030.
Learn more about the Trade Triangles and how we make technical analysis as easy as buy and sell.
|
|||||||||||||||
|
|||||||||||||||
MarketClub’s Trade Triangles for SP600-151030
![]() The long-term trend has been DOWN since Mar 4th, 2026 at 458.52
The long-term trend has been DOWN since Mar 4th, 2026 at 458.52
![]() The intermediate-term trend has been UP since Apr 17th, 2026 at 461.67
The intermediate-term trend has been UP since Apr 17th, 2026 at 461.67
![]() The short-term trend has been UP since Apr 17th, 2026 at 461.67
The short-term trend has been UP since Apr 17th, 2026 at 461.67
Smart Scan Analysis for SP600-151030
Based on our trend formula, SP600-151030 is rated as a +60 on a scale from -100 (Strong Downtrend) to +100 (Strong Uptrend).
| Open | High | Low | Price | Change |
|---|---|---|---|---|
| 441.27 | 462.71 | 441.27 | 453.34 | +19.98 |
| Prev. Close | Volume | Bid | Ask | Time |
| 453.34 | 1512225 | 2026-04-17 16:19:26 |
| 52wk High | 570.35 | 52wk High Date | 2018-09-21 |
| 52wk Low | 338.55 | 52wk Low Date | 2018-10-26 |