Index Trend Analysis Report
Prepared for you on Friday, April 19, 2024.
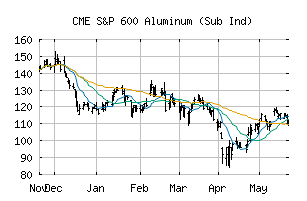
S&P 600 Aluminum (Sub Ind) (CME:SP600-15104010)
Countertrend Up (+85) - SP600-15104010 is showing short-term weakness. However, look for the longer-term bullish trend to resume. As always, continue to monitor the trend score and utilize a stop order.
Is it time to buy, sell, or avoid SP600-15104010?
MarketClub looks at technical strength and momentum to determine if the timing is right for SP600-15104010.
Learn more about the Trade Triangles and how we make technical analysis as easy as buy and sell.
|
|||||||||||||||
|
|||||||||||||||
MarketClub’s Trade Triangles for SP600-15104010
![]() The long-term trend has been UP since Dec 19th, 2023 at 97.28
The long-term trend has been UP since Dec 19th, 2023 at 97.28
![]() The intermediate-term trend has been UP since Mar 1st, 2024 at 99.06
The intermediate-term trend has been UP since Mar 1st, 2024 at 99.06
![]() The short-term trend has been DOWN since Apr 16th, 2024 at 129.95
The short-term trend has been DOWN since Apr 16th, 2024 at 129.95
Smart Scan Analysis for SP600-15104010
Based on our trend formula, SP600-15104010 is rated as a +85 on a scale from -100 (Strong Downtrend) to +100 (Strong Uptrend).
| Open | High | Low | Price | Change |
|---|---|---|---|---|
| 135.47 | 137.06 | 132.37 | 135.14 | -0.08 |
| Prev. Close | Volume | Bid | Ask | Time |
| 135.14 | 1393271 | 2024-04-18 16:19:41 |
| 52wk High | 110.86 | 52wk High Date | 2018-01-29 |
| 52wk Low | 65.08 | 52wk Low Date | 2018-10-30 |