Index Trend Analysis Report
Prepared for you on Friday, July 26, 2024.
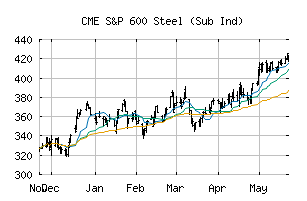
S&P 600 Steel (Sub Ind) (CME:SP600-15104050)
Long-Term Uptrend (+90) - SP600-15104050 is in a strong uptrend that is likely to continue. While SP600-15104050 is showing intraday weakness, it remains in the confines of a bullish trend. Traders should use caution and utilize a stop order.
Is it time to buy, sell, or avoid SP600-15104050?
MarketClub looks at technical strength and momentum to determine if the timing is right for SP600-15104050.
Learn more about the Trade Triangles and how we make technical analysis as easy as buy and sell.
|
|||||||||||||||
|
|||||||||||||||
MarketClub’s Trade Triangles for SP600-15104050
![]() The long-term trend has been UP since Nov 14th, 2023 at 317.94
The long-term trend has been UP since Nov 14th, 2023 at 317.94
![]() The intermediate-term trend has been UP since Jul 1st, 2024 at 413.06
The intermediate-term trend has been UP since Jul 1st, 2024 at 413.06
![]() The short-term trend has been UP since Jul 23rd, 2024 at 432.65
The short-term trend has been UP since Jul 23rd, 2024 at 432.65
Smart Scan Analysis for SP600-15104050
Based on our trend formula, SP600-15104050 is rated as a +90 on a scale from -100 (Strong Downtrend) to +100 (Strong Uptrend).
| Open | High | Low | Price | Change |
|---|---|---|---|---|
| 445.61 | 455.10 | 443.46 | 452.66 | +11.44 |
| Prev. Close | Volume | Bid | Ask | Time |
| 441.22 | 4660235 | 2024-07-26 16:19:56 |
| 52wk High | 235.07 | 52wk High Date | 2018-01-17 |
| 52wk Low | 136.65 | 52wk Low Date | 2018-11-28 |