Index Trend Analysis Report
Prepared for you on Wednesday, April 1, 2026.
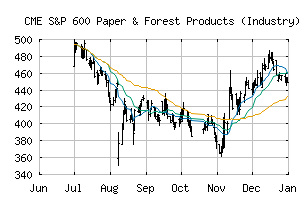
S&P 600 Paper & Forest Products (Industry) (CME:SP600-151050)
Sidelines Mode (-55) - SP600-151050 is moving in a sideways pattern and is unable to gain momentum in either direction. Beware of choppy movement and consider a sidelines position until a stronger trend is identified.
Is it time to buy, sell, or avoid SP600-151050?
MarketClub looks at technical strength and momentum to determine if the timing is right for SP600-151050.
Learn more about the Trade Triangles and how we make technical analysis as easy as buy and sell.
|
|||||||||||||||
|
|||||||||||||||
MarketClub’s Trade Triangles for SP600-151050
![]() The long-term trend has been DOWN since Mar 6th, 2026 at 412.22
The long-term trend has been DOWN since Mar 6th, 2026 at 412.22
![]() The intermediate-term trend has been DOWN since Feb 12th, 2026 at 443.67
The intermediate-term trend has been DOWN since Feb 12th, 2026 at 443.67
![]() The short-term trend has been UP since Mar 24th, 2026 at 369.23
The short-term trend has been UP since Mar 24th, 2026 at 369.23
Smart Scan Analysis for SP600-151050
Based on our trend formula, SP600-151050 is rated as a -55 on a scale from -100 (Strong Downtrend) to +100 (Strong Uptrend).
| Open | High | Low | Price | Change |
|---|---|---|---|---|
| 390.84 | 395.60 | 385.15 | 394.29 | +7.28 |
| Prev. Close | Volume | Bid | Ask | Time |
| 387.01 | 392039 | 2026-03-31 16:19:41 |
| 52wk High | 670.86 | 52wk High Date | 2018-01-29 |
| 52wk Low | 457.71 | 52wk Low Date | 2018-11-28 |