Index Trend Analysis Report
Prepared for you on Friday, April 26, 2024.
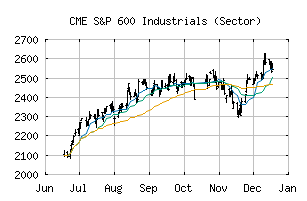
S&P 600 Industrials (Sector) (CME:SP600-20)
Crossroads (-60) - SP600-20 is struggling to move into a solid trend. Beware of choppy markets and consider a sidelines position until a stronger trend is identified.
Is it time to buy, sell, or avoid SP600-20?
MarketClub looks at technical strength and momentum to determine if the timing is right for SP600-20.
Learn more about the Trade Triangles and how we make technical analysis as easy as buy and sell.
|
|||||||||||||||
|
|||||||||||||||
MarketClub’s Trade Triangles for SP600-20
![]() The long-term trend has been UP since Dec 1st, 2023 at 1747.39
The long-term trend has been UP since Dec 1st, 2023 at 1747.39
![]() The intermediate-term trend has been DOWN since Apr 15th, 2024 at 1997.15
The intermediate-term trend has been DOWN since Apr 15th, 2024 at 1997.15
![]() The short-term trend has been DOWN since Apr 25th, 2024 at 1970.92
The short-term trend has been DOWN since Apr 25th, 2024 at 1970.92
Smart Scan Analysis for SP600-20
Based on our trend formula, SP600-20 is rated as a -60 on a scale from -100 (Strong Downtrend) to +100 (Strong Uptrend).
| Open | High | Low | Price | Change |
|---|---|---|---|---|
| 1997.41 | 2015.50 | 1996.44 | 2010.32 | +13.48 |
| Prev. Close | Volume | Bid | Ask | Time |
| 1996.84 | 30552632 | 2024-04-26 13:55:54 |
| 52wk High | 1243.44 | 52wk High Date | 2018-08-27 |
| 52wk Low | 985.81 | 52wk Low Date | 2018-02-09 |