Index Trend Analysis Report
Prepared for you on Tuesday, March 24, 2026.
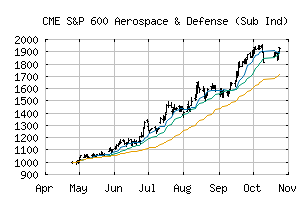
S&P 600 Aerospace & Defense (Sub Ind) (CME:SP600-20101010)
Weak Downtrend (-65) - SP600-20101010 is showing signs of a strengthening downtrend. Monitor SP600-20101010 as it may be building momentum to the downside.
Is it time to buy, sell, or avoid SP600-20101010?
MarketClub looks at technical strength and momentum to determine if the timing is right for SP600-20101010.
Learn more about the Trade Triangles and how we make technical analysis as easy as buy and sell.
|
|||||||||||||||
|
|||||||||||||||
MarketClub’s Trade Triangles for SP600-20101010
![]() The long-term trend has been UP since Jun 2nd, 2025 at 1116.07
The long-term trend has been UP since Jun 2nd, 2025 at 1116.07
![]() The intermediate-term trend has been DOWN since Mar 5th, 2026 at 2494.11
The intermediate-term trend has been DOWN since Mar 5th, 2026 at 2494.11
![]() The short-term trend has been DOWN since Mar 19th, 2026 at 2381.60
The short-term trend has been DOWN since Mar 19th, 2026 at 2381.60
Smart Scan Analysis for SP600-20101010
Based on our trend formula, SP600-20101010 is rated as a -70 on a scale from -100 (Strong Downtrend) to +100 (Strong Uptrend).
| Open | High | Low | Price | Change |
|---|---|---|---|---|
| 2301.59 | 2337.15 | 2275.97 | 2310.69 | -18.63 |
| Prev. Close | Volume | Bid | Ask | Time |
| 2329.32 | 941138 | 2026-03-24 14:07:56 |
| 52wk High | 601.2 | 52wk High Date | 2018-09-18 |
| 52wk Low | 403.81 | 52wk Low Date | 2018-02-06 |