Index Trend Analysis Report
Prepared for you on Monday, March 30, 2026.
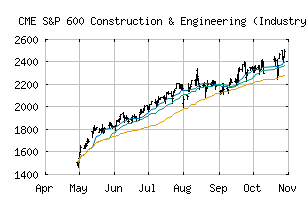
S&P 600 Construction & Engineering (Industry) (CME:SP600-201030)
Bull Market Weakness (+75) - SP600-201030 is showing signs of short-term weakness, but still remains in the confines of a long-term uptrend. Keep an eye on SP600-201030 as it may be in the beginning stages of a reversal.
Is it time to buy, sell, or avoid SP600-201030?
MarketClub looks at technical strength and momentum to determine if the timing is right for SP600-201030.
Learn more about the Trade Triangles and how we make technical analysis as easy as buy and sell.
|
|||||||||||||||
|
|||||||||||||||
MarketClub’s Trade Triangles for SP600-201030
![]() The long-term trend has been UP since Jun 3rd, 2025 at 1865.32
The long-term trend has been UP since Jun 3rd, 2025 at 1865.32
![]() The intermediate-term trend has been DOWN since Mar 3rd, 2026 at 3006.51
The intermediate-term trend has been DOWN since Mar 3rd, 2026 at 3006.51
![]() The short-term trend has been UP since Mar 27th, 2026 at 2949.37
The short-term trend has been UP since Mar 27th, 2026 at 2949.37
Smart Scan Analysis for SP600-201030
Based on our trend formula, SP600-201030 is rated as a +75 on a scale from -100 (Strong Downtrend) to +100 (Strong Uptrend).
| Open | High | Low | Price | Change |
|---|---|---|---|---|
| 2890.66 | 2984.48 | 2886.40 | 2948.24 | +159.00 |
| Prev. Close | Volume | Bid | Ask | Time |
| 2948.24 | 5948119 | 2026-03-27 16:34:13 |
| 52wk High | 530.99 | 52wk High Date | 2018-07-27 |
| 52wk Low | 392.8 | 52wk Low Date | 2018-04-02 |