Index Trend Analysis Report
Prepared for you on Sunday, April 5, 2026.
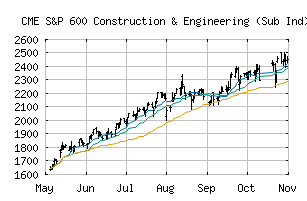
S&P 600 Construction & Engineering (Sub Ind) (CME:SP600-20103010)
Long-Term Uptrend (+90) - SP600-20103010 is in a strong uptrend that is likely to continue. While SP600-20103010 is showing intraday weakness, it remains in the confines of a bullish trend. Traders should use caution and utilize a stop order.
Is it time to buy, sell, or avoid SP600-20103010?
MarketClub looks at technical strength and momentum to determine if the timing is right for SP600-20103010.
Learn more about the Trade Triangles and how we make technical analysis as easy as buy and sell.
|
|||||||||||||||
|
|||||||||||||||
MarketClub’s Trade Triangles for SP600-20103010
![]() The long-term trend has been UP since Jun 3rd, 2025 at 1865.32
The long-term trend has been UP since Jun 3rd, 2025 at 1865.32
![]() The intermediate-term trend has been UP since Mar 30th, 2026 at 2984.48
The intermediate-term trend has been UP since Mar 30th, 2026 at 2984.48
![]() The short-term trend has been UP since Mar 27th, 2026 at 2949.37
The short-term trend has been UP since Mar 27th, 2026 at 2949.37
Smart Scan Analysis for SP600-20103010
Based on our trend formula, SP600-20103010 is rated as a +90 on a scale from -100 (Strong Downtrend) to +100 (Strong Uptrend).
| Open | High | Low | Price | Change |
|---|---|---|---|---|
| 3004.07 | 3106.13 | 2981.63 | 3047.27 | -24.52 |
| Prev. Close | Volume | Bid | Ask | Time |
| 3047.27 | 3849270 | 2026-04-02 16:19:11 |
| 52wk High | 530.99 | 52wk High Date | 2018-07-27 |
| 52wk Low | 392.8 | 52wk Low Date | 2018-04-02 |