Index Trend Analysis Report
Prepared for you on Thursday, December 26, 2024.
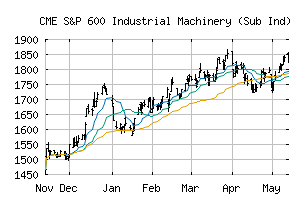
S&P 600 Industrial Machinery (Sub Ind) (CME:SP600-20106020)
Crossroads (-60) - SP600-20106020 is struggling to move into a solid trend. Beware of choppy markets and consider a sidelines position until a stronger trend is identified.
Is it time to buy, sell, or avoid SP600-20106020?
MarketClub looks at technical strength and momentum to determine if the timing is right for SP600-20106020.
Learn more about the Trade Triangles and how we make technical analysis as easy as buy and sell.
|
|||||||||||||||
|
|||||||||||||||
MarketClub’s Trade Triangles for SP600-20106020
![]() The long-term trend has been UP since Nov 5th, 2024 at 1997.19
The long-term trend has been UP since Nov 5th, 2024 at 1997.19
![]() The intermediate-term trend has been DOWN since Dec 6th, 2024 at 2117.67
The intermediate-term trend has been DOWN since Dec 6th, 2024 at 2117.67
![]() The short-term trend has been DOWN since Dec 5th, 2024 at 2175.36
The short-term trend has been DOWN since Dec 5th, 2024 at 2175.36
Smart Scan Analysis for SP600-20106020
Based on our trend formula, SP600-20106020 is rated as a -60 on a scale from -100 (Strong Downtrend) to +100 (Strong Uptrend).
| Open | High | Low | Price | Change |
|---|---|---|---|---|
| 1983.61 | 2006.62 | 1979.91 | 2005.34 | +23.36 |
| Prev. Close | Volume | Bid | Ask | Time |
| 2005.34 | 2467705 | 2024-12-24 13:19:56 |
| 52wk High | 1231.66 | 52wk High Date | 2018-09-21 |
| 52wk Low | 962.51 | 52wk Low Date | 2018-10-29 |