Index Trend Analysis Report
Prepared for you on Monday, March 30, 2026.
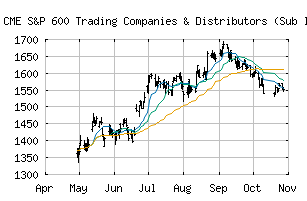
S&P 600 Trading Companies & Distributors (Sub Ind) (CME:SP600-20107010)
Weak Uptrend (+65) - SP600-20107010 is showing signs of weakening momentum to the upside. Monitor SP600-20107010 as it may be in the beginning stages of a reversal.
Is it time to buy, sell, or avoid SP600-20107010?
MarketClub looks at technical strength and momentum to determine if the timing is right for SP600-20107010.
Learn more about the Trade Triangles and how we make technical analysis as easy as buy and sell.
|
|||||||||||||||
|
|||||||||||||||
MarketClub’s Trade Triangles for SP600-20107010
![]() The long-term trend has been UP since Jan 9th, 2026 at 1619.44
The long-term trend has been UP since Jan 9th, 2026 at 1619.44
![]() The intermediate-term trend has been DOWN since Feb 27th, 2026 at 1687.26
The intermediate-term trend has been DOWN since Feb 27th, 2026 at 1687.26
![]() The short-term trend has been UP since Mar 23rd, 2026 at 1608.34
The short-term trend has been UP since Mar 23rd, 2026 at 1608.34
Smart Scan Analysis for SP600-20107010
Based on our trend formula, SP600-20107010 is rated as a +65 on a scale from -100 (Strong Downtrend) to +100 (Strong Uptrend).
| Open | High | Low | Price | Change |
|---|---|---|---|---|
| 1632.40 | 1648.71 | 1628.28 | 1640.95 | +4.07 |
| Prev. Close | Volume | Bid | Ask | Time |
| 1640.95 | 5569496 | 2026-03-27 16:34:13 |
| 52wk High | 673.66 | 52wk High Date | 2018-08-21 |
| 52wk Low | 509.17 | 52wk Low Date | 2017-12-14 |