Index Trend Analysis Report
Prepared for you on Friday, May 9, 2025.
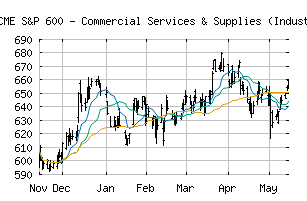
S&P 600 - Commercial Services & Supplies (Industry) (CME:SP600-202010)
Sidelines Mode (-55) - SP600-202010 is moving in a sideways pattern and is unable to gain momentum in either direction. Beware of choppy movement and consider a sidelines position until a stronger trend is identified.
Is it time to buy, sell, or avoid SP600-202010?
MarketClub looks at technical strength and momentum to determine if the timing is right for SP600-202010.
Learn more about the Trade Triangles and how we make technical analysis as easy as buy and sell.
|
|||||||||||||||
|
|||||||||||||||
MarketClub’s Trade Triangles for SP600-202010
![]() The long-term trend has been DOWN since Mar 3rd, 2025 at 759.57
The long-term trend has been DOWN since Mar 3rd, 2025 at 759.57
![]() The intermediate-term trend has been UP since Apr 28th, 2025 at 721.95
The intermediate-term trend has been UP since Apr 28th, 2025 at 721.95
![]() The short-term trend has been DOWN since May 7th, 2025 at 728.75
The short-term trend has been DOWN since May 7th, 2025 at 728.75
Smart Scan Analysis for SP600-202010
Based on our trend formula, SP600-202010 is rated as a -55 on a scale from -100 (Strong Downtrend) to +100 (Strong Uptrend).
| Open | High | Low | Price | Change |
|---|---|---|---|---|
| 723.51 | 744.20 | 723.06 | 731.33 | +15.55 |
| Prev. Close | Volume | Bid | Ask | Time |
| 731.33 | 32070240 | 2025-05-08 16:19:11 |
| 52wk High | 760.33 | 52wk High Date | 2018-09-14 |
| 52wk Low | 631.23 | 52wk Low Date | 2018-10-26 |