Index Trend Analysis Report
Prepared for you on Tuesday, July 1, 2025.
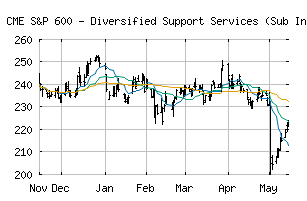
S&P 600 - Diversified Support Services (Sub Ind) (CME:SP600-20201070)
Strong Uptrend (+100) - SP600-20201070 is in a strong uptrend that is likely to continue. With short-term, intermediate, and long-term bullish momentum, SP600-20201070 continues to climb. Traders should protect gains and look for a change in score to suggest a slow down in momentum.
Is it time to buy, sell, or avoid SP600-20201070?
MarketClub looks at technical strength and momentum to determine if the timing is right for SP600-20201070.
Learn more about the Trade Triangles and how we make technical analysis as easy as buy and sell.
|
|||||||||||||||
|
|||||||||||||||
MarketClub’s Trade Triangles for SP600-20201070
![]() The long-term trend has been UP since Jul 1st, 2025 at 229.59
The long-term trend has been UP since Jul 1st, 2025 at 229.59
![]() The intermediate-term trend has been UP since Jul 1st, 2025 at 229.59
The intermediate-term trend has been UP since Jul 1st, 2025 at 229.59
![]() The short-term trend has been UP since Jun 24th, 2025 at 219.73
The short-term trend has been UP since Jun 24th, 2025 at 219.73
Smart Scan Analysis for SP600-20201070
Based on our trend formula, SP600-20201070 is rated as a +100 on a scale from -100 (Strong Downtrend) to +100 (Strong Uptrend).
| Open | High | Low | Price | Change |
|---|---|---|---|---|
| 226.01 | 233.59 | 226.01 | 232.57 | +5.49 |
| Prev. Close | Volume | Bid | Ask | Time |
| 227.08 | 2418603 | 2025-07-01 13:36:56 |
| 52wk High | 352.38 | 52wk High Date | 2018-07-10 |
| 52wk Low | 263.84 | 52wk Low Date | 2018-10-26 |