Index Trend Analysis Report
Prepared for you on Sunday, April 5, 2026.
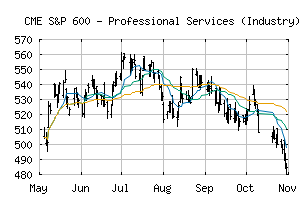
S&P 600 - Professional Services (Industry) (CME:SP600-202020)
Sidelines Mode (-55) - SP600-202020 is moving in a sideways pattern and is unable to gain momentum in either direction. Beware of choppy movement and consider a sidelines position until a stronger trend is identified.
Is it time to buy, sell, or avoid SP600-202020?
MarketClub looks at technical strength and momentum to determine if the timing is right for SP600-202020.
Learn more about the Trade Triangles and how we make technical analysis as easy as buy and sell.
|
|||||||||||||||
|
|||||||||||||||
MarketClub’s Trade Triangles for SP600-202020
![]() The long-term trend has been DOWN since Feb 12th, 2026 at 469.12
The long-term trend has been DOWN since Feb 12th, 2026 at 469.12
![]() The intermediate-term trend has been DOWN since Feb 3rd, 2026 at 531.22
The intermediate-term trend has been DOWN since Feb 3rd, 2026 at 531.22
![]() The short-term trend has been UP since Apr 2nd, 2026 at 428.36
The short-term trend has been UP since Apr 2nd, 2026 at 428.36
Smart Scan Analysis for SP600-202020
Based on our trend formula, SP600-202020 is rated as a -55 on a scale from -100 (Strong Downtrend) to +100 (Strong Uptrend).
| Open | High | Low | Price | Change |
|---|---|---|---|---|
| 417.04 | 430.13 | 413.39 | 426.78 | +7.99 |
| Prev. Close | Volume | Bid | Ask | Time |
| 426.78 | 14046058 | 2026-04-02 16:19:11 |
| 52wk High | 442.94 | 52wk High Date | 2018-09-04 |
| 52wk Low | 297.79 | 52wk Low Date | 2018-02-09 |