Index Trend Analysis Report
Prepared for you on Monday, August 18, 2025.
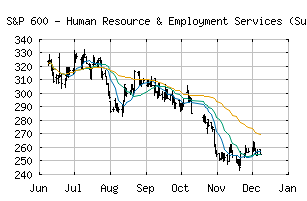
S&P 600 - Human Resource & Employment Services (Sub Ind) (CME:SP600-20202010)
Sidelines Mode (-55) - SP600-20202010 is moving in a sideways pattern and is unable to gain momentum in either direction. Beware of choppy movement and consider a sidelines position until a stronger trend is identified.
Is it time to buy, sell, or avoid SP600-20202010?
MarketClub looks at technical strength and momentum to determine if the timing is right for SP600-20202010.
Learn more about the Trade Triangles and how we make technical analysis as easy as buy and sell.
|
|||||||||||||||
|
|||||||||||||||
MarketClub’s Trade Triangles for SP600-20202010
![]() The long-term trend has been DOWN since Jan 8th, 2025 at 396.86
The long-term trend has been DOWN since Jan 8th, 2025 at 396.86
![]() The intermediate-term trend has been DOWN since Jul 25th, 2025 at 310.41
The intermediate-term trend has been DOWN since Jul 25th, 2025 at 310.41
![]() The short-term trend has been UP since Aug 12th, 2025 at 292.86
The short-term trend has been UP since Aug 12th, 2025 at 292.86
Smart Scan Analysis for SP600-20202010
Based on our trend formula, SP600-20202010 is rated as a -55 on a scale from -100 (Strong Downtrend) to +100 (Strong Uptrend).
| Open | High | Low | Price | Change |
|---|---|---|---|---|
| 300.64 | 302.19 | 299.56 | 301.88 | +1.61 |
| Prev. Close | Volume | Bid | Ask | Time |
| 300.27 | 645296 | 2025-08-18 14:00:56 |
| 52wk High | 400.16 | 52wk High Date | 2018-08-27 |
| 52wk Low | 272.72 | 52wk Low Date | 2018-02-09 |