Index Trend Analysis Report
Prepared for you on Wednesday, March 25, 2026.
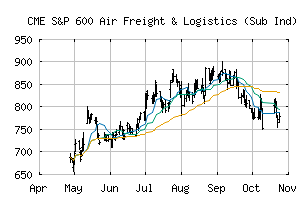
S&P 600 Air Freight & Logistics (Sub Ind) (CME:SP600-20301010)
Bear Market Rally (-75) - SP600-20301010 is showing some rallying power, but still remains in the confines of a long-term downtrend. Keep an eye on SP600-20301010 as it may be in the beginning of a reversal.
Is it time to buy, sell, or avoid SP600-20301010?
MarketClub looks at technical strength and momentum to determine if the timing is right for SP600-20301010.
Learn more about the Trade Triangles and how we make technical analysis as easy as buy and sell.
|
|||||||||||||||
|
|||||||||||||||
MarketClub’s Trade Triangles for SP600-20301010
![]() The long-term trend has been DOWN since Mar 6th, 2026 at 849.58
The long-term trend has been DOWN since Mar 6th, 2026 at 849.58
![]() The intermediate-term trend has been DOWN since Feb 6th, 2026 at 1012.23
The intermediate-term trend has been DOWN since Feb 6th, 2026 at 1012.23
![]() The short-term trend has been UP since Mar 20th, 2026 at 747.56
The short-term trend has been UP since Mar 20th, 2026 at 747.56
Smart Scan Analysis for SP600-20301010
Based on our trend formula, SP600-20301010 is rated as a -75 on a scale from -100 (Strong Downtrend) to +100 (Strong Uptrend).
| Open | High | Low | Price | Change |
|---|---|---|---|---|
| 769.15 | 775.57 | 743.48 | 771.30 | +7.75 |
| Prev. Close | Volume | Bid | Ask | Time |
| 763.55 | 1088780 | 2026-03-25 16:19:26 |
| 52wk High | 959.01 | 52wk High Date | 2018-06-22 |
| 52wk Low | 736.35 | 52wk Low Date | 2018-10-25 |