Index Trend Analysis Report
Prepared for you on Friday, May 9, 2025.
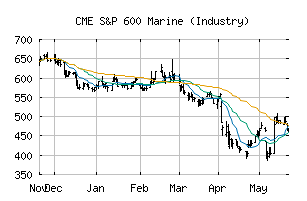
S&P 600 Marine (Industry) (CME:SP600-203030)
Long-Term Downtrend (-90) - SP600-203030 is in a strong downtrend that is likely to continue. While SP600-203030 is showing intraday strength, it remains in the confines of a bearish trend. Traders should use caution and set stops.
Is it time to buy, sell, or avoid SP600-203030?
MarketClub looks at technical strength and momentum to determine if the timing is right for SP600-203030.
Learn more about the Trade Triangles and how we make technical analysis as easy as buy and sell.
|
|||||||||||||||
|
|||||||||||||||
MarketClub’s Trade Triangles for SP600-203030
![]() The long-term trend has been DOWN since Mar 6th, 2025 at 564.78
The long-term trend has been DOWN since Mar 6th, 2025 at 564.78
![]() The intermediate-term trend has been DOWN since Mar 4th, 2025 at 574.71
The intermediate-term trend has been DOWN since Mar 4th, 2025 at 574.71
![]() The short-term trend has been DOWN since May 6th, 2025 at 450.57
The short-term trend has been DOWN since May 6th, 2025 at 450.57
Smart Scan Analysis for SP600-203030
Based on our trend formula, SP600-203030 is rated as a -90 on a scale from -100 (Strong Downtrend) to +100 (Strong Uptrend).
| Open | High | Low | Price | Change |
|---|---|---|---|---|
| 405.56 | 419.39 | 394.76 | 417.92 | +20.12 |
| Prev. Close | Volume | Bid | Ask | Time |
| 417.92 | 944599 | 2025-05-08 16:19:09 |
| 52wk High | 177.05 | 52wk High Date | 2018-11-06 |
| 52wk Low | 117 | 52wk Low Date | 2017-12-14 |