Index Trend Analysis Report
Prepared for you on Wednesday, April 1, 2026.
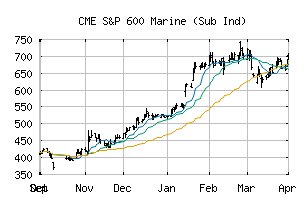
S&P 600 Marine (Sub Ind) (CME:SP600-20303010)
Long-Term Uptrend (+90) - SP600-20303010 is in a strong uptrend that is likely to continue. While SP600-20303010 is showing intraday weakness, it remains in the confines of a bullish trend. Traders should use caution and utilize a stop order.
Is it time to buy, sell, or avoid SP600-20303010?
MarketClub looks at technical strength and momentum to determine if the timing is right for SP600-20303010.
Learn more about the Trade Triangles and how we make technical analysis as easy as buy and sell.
|
|||||||||||||||
|
|||||||||||||||
MarketClub’s Trade Triangles for SP600-20303010
![]() The long-term trend has been UP since Dec 3rd, 2025 at 481.12
The long-term trend has been UP since Dec 3rd, 2025 at 481.12
![]() The intermediate-term trend has been UP since Apr 1st, 2026 at 697.70
The intermediate-term trend has been UP since Apr 1st, 2026 at 697.70
![]() The short-term trend has been UP since Apr 1st, 2026 at 690.84
The short-term trend has been UP since Apr 1st, 2026 at 690.84
Smart Scan Analysis for SP600-20303010
Based on our trend formula, SP600-20303010 is rated as a +90 on a scale from -100 (Strong Downtrend) to +100 (Strong Uptrend).
| Open | High | Low | Price | Change |
|---|---|---|---|---|
| 702.25 | 709.74 | 696.82 | 700.23 | +9.98 |
| Prev. Close | Volume | Bid | Ask | Time |
| 690.25 | 87211 | 2026-04-01 14:19:09 |
| 52wk High | 177.05 | 52wk High Date | 2018-11-06 |
| 52wk Low | 117 | 52wk Low Date | 2017-12-14 |