Index Trend Analysis Report
Prepared for you on Wednesday, May 1, 2024.
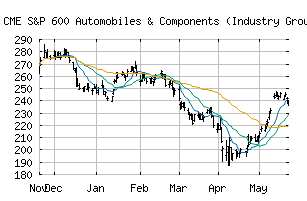
S&P 600 Automobiles & Components (Industry Group) (CME:SP600-2510)
Long-Term Downtrend (-90) - SP600-2510 is in a strong downtrend that is likely to continue. While SP600-2510 is showing intraday strength, it remains in the confines of a bearish trend. Traders should use caution and set stops.
Is it time to buy, sell, or avoid SP600-2510?
MarketClub looks at technical strength and momentum to determine if the timing is right for SP600-2510.
Learn more about the Trade Triangles and how we make technical analysis as easy as buy and sell.
|
|||||||||||||||
|
|||||||||||||||
MarketClub’s Trade Triangles for SP600-2510
![]() The long-term trend has been DOWN since Apr 18th, 2024 at 247.06
The long-term trend has been DOWN since Apr 18th, 2024 at 247.06
![]() The intermediate-term trend has been DOWN since Apr 15th, 2024 at 256.07
The intermediate-term trend has been DOWN since Apr 15th, 2024 at 256.07
![]() The short-term trend has been DOWN since Apr 25th, 2024 at 249.98
The short-term trend has been DOWN since Apr 25th, 2024 at 249.98
Smart Scan Analysis for SP600-2510
Based on our trend formula, SP600-2510 is rated as a -90 on a scale from -100 (Strong Downtrend) to +100 (Strong Uptrend).
| Open | High | Low | Price | Change |
|---|---|---|---|---|
| 251.35 | 253.52 | 250.36 | 253.05 | +2.99 |
| Prev. Close | Volume | Bid | Ask | Time |
| 250.06 | 1213856 | 2024-05-01 09:45:26 |
| 52wk High | 298.87 | 52wk High Date | 2018-08-27 |
| 52wk Low | 224.33 | 52wk Low Date | 2018-10-24 |