Index Trend Analysis Report
Prepared for you on Monday, March 23, 2026.
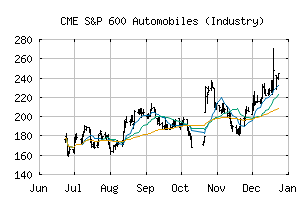
S&P 600 Automobiles (Industry) (CME:SP600-251020)
Countertrend Down (-85) - SP600-251020 is showing short-term strength. However, look for the longer-term bearish trend to resume. As always, continue to monitor the trend score and set stops.
Is it time to buy, sell, or avoid SP600-251020?
MarketClub looks at technical strength and momentum to determine if the timing is right for SP600-251020.
Learn more about the Trade Triangles and how we make technical analysis as easy as buy and sell.
|
|||||||||||||||
|
|||||||||||||||
MarketClub’s Trade Triangles for SP600-251020
![]() The long-term trend has been DOWN since Mar 9th, 2026 at 202.67
The long-term trend has been DOWN since Mar 9th, 2026 at 202.67
![]() The intermediate-term trend has been DOWN since Feb 23rd, 2026 at 254.35
The intermediate-term trend has been DOWN since Feb 23rd, 2026 at 254.35
![]() The short-term trend has been UP since Mar 23rd, 2026 at 191.36
The short-term trend has been UP since Mar 23rd, 2026 at 191.36
Smart Scan Analysis for SP600-251020
Based on our trend formula, SP600-251020 is rated as a -85 on a scale from -100 (Strong Downtrend) to +100 (Strong Uptrend).
| Open | High | Low | Price | Change |
|---|---|---|---|---|
| 194.08 | 198.64 | 191.81 | 195.04 | +5.69 |
| Prev. Close | Volume | Bid | Ask | Time |
| 189.35 | 304872 | 2026-03-23 15:30:11 |
| 52wk High | 331.54 | 52wk High Date | 2017-12-20 |
| 52wk Low | 133.92 | 52wk Low Date | 2018-11-28 |