Index Trend Analysis Report
Prepared for you on Friday, April 26, 2024.
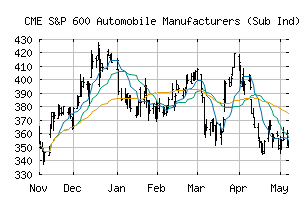
S&P 600 Automobile Manufacturers (Sub Ind) (CME:SP600-25102010)
Long-Term Downtrend (-90) - SP600-25102010 is in a strong downtrend that is likely to continue. While SP600-25102010 is showing intraday strength, it remains in the confines of a bearish trend. Traders should use caution and set stops.
Is it time to buy, sell, or avoid SP600-25102010?
MarketClub looks at technical strength and momentum to determine if the timing is right for SP600-25102010.
Learn more about the Trade Triangles and how we make technical analysis as easy as buy and sell.
|
|||||||||||||||
|
|||||||||||||||
MarketClub’s Trade Triangles for SP600-25102010
![]() The long-term trend has been DOWN since Mar 6th, 2024 at 364.05
The long-term trend has been DOWN since Mar 6th, 2024 at 364.05
![]() The intermediate-term trend has been DOWN since Apr 15th, 2024 at 365.15
The intermediate-term trend has been DOWN since Apr 15th, 2024 at 365.15
![]() The short-term trend has been DOWN since Apr 25th, 2024 at 354.72
The short-term trend has been DOWN since Apr 25th, 2024 at 354.72
Smart Scan Analysis for SP600-25102010
Based on our trend formula, SP600-25102010 is rated as a -90 on a scale from -100 (Strong Downtrend) to +100 (Strong Uptrend).
| Open | High | Low | Price | Change |
|---|---|---|---|---|
| 354.16 | 359.60 | 354.16 | 357.33 | +3.06 |
| Prev. Close | Volume | Bid | Ask | Time |
| 354.27 | 192294 | 2024-04-26 15:52:56 |
| 52wk High | 331.54 | 52wk High Date | 2017-12-20 |
| 52wk Low | 133.92 | 52wk Low Date | 2018-11-28 |