Index Trend Analysis Report
Prepared for you on Monday, May 12, 2025.
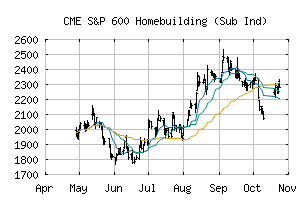
S&P 600 Homebuilding (Sub Ind) (CME:SP600-25201030)
Bull Market Weakness (+75) - SP600-25201030 is showing signs of short-term weakness, but still remains in the confines of a long-term uptrend. Keep an eye on SP600-25201030 as it may be in the beginning stages of a reversal.
Is it time to buy, sell, or avoid SP600-25201030?
MarketClub looks at technical strength and momentum to determine if the timing is right for SP600-25201030.
Learn more about the Trade Triangles and how we make technical analysis as easy as buy and sell.
|
|||||||||||||||
|
|||||||||||||||
MarketClub’s Trade Triangles for SP600-25201030
![]() The long-term trend has been DOWN since Dec 13th, 2024 at 2459.53
The long-term trend has been DOWN since Dec 13th, 2024 at 2459.53
![]() The intermediate-term trend has been UP since May 12th, 2025 at 2071.30
The intermediate-term trend has been UP since May 12th, 2025 at 2071.30
![]() The short-term trend has been UP since May 1st, 2025 at 2011.13
The short-term trend has been UP since May 1st, 2025 at 2011.13
Smart Scan Analysis for SP600-25201030
Based on our trend formula, SP600-25201030 is rated as a +70 on a scale from -100 (Strong Downtrend) to +100 (Strong Uptrend).
| Open | High | Low | Price | Change |
|---|---|---|---|---|
| 2098.01 | 2158.51 | 2068.40 | 2099.34 | +73.32 |
| Prev. Close | Volume | Bid | Ask | Time |
| 2026.02 | 4907848 | 2025-05-12 16:47:21 |
| 52wk High | 884.24 | 52wk High Date | 2018-01-09 |
| 52wk Low | 543.5 | 52wk Low Date | 2018-10-23 |