Index Trend Analysis Report
Prepared for you on Wednesday, January 7, 2026.
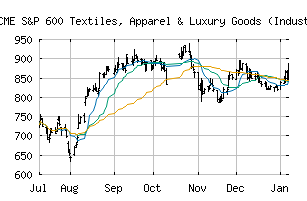
S&P 600 Textiles, Apparel & Luxury Goods (Industry) (CME:SP600-252030)
Long-Term Uptrend (+90) - SP600-252030 is in a strong uptrend that is likely to continue. While SP600-252030 is showing intraday weakness, it remains in the confines of a bullish trend. Traders should use caution and utilize a stop order.
Is it time to buy, sell, or avoid SP600-252030?
MarketClub looks at technical strength and momentum to determine if the timing is right for SP600-252030.
Learn more about the Trade Triangles and how we make technical analysis as easy as buy and sell.
|
|||||||||||||||
|
|||||||||||||||
MarketClub’s Trade Triangles for SP600-252030
![]() The long-term trend has been UP since Aug 12th, 2025 at 795.70
The long-term trend has been UP since Aug 12th, 2025 at 795.70
![]() The intermediate-term trend has been UP since Jan 6th, 2026 at 867.11
The intermediate-term trend has been UP since Jan 6th, 2026 at 867.11
![]() The short-term trend has been UP since Dec 30th, 2025 at 830.44
The short-term trend has been UP since Dec 30th, 2025 at 830.44
Smart Scan Analysis for SP600-252030
Based on our trend formula, SP600-252030 is rated as a +90 on a scale from -100 (Strong Downtrend) to +100 (Strong Uptrend).
| Open | High | Low | Price | Change |
|---|---|---|---|---|
| 864.76 | 869.53 | 846.07 | 849.14 | -17.20 |
| Prev. Close | Volume | Bid | Ask | Time |
| 866.34 | 35122762 | 2026-01-07 16:19:56 |
| 52wk High | 737.26 | 52wk High Date | 2018-08-23 |
| 52wk Low | 478.58 | 52wk Low Date | 2017-12-01 |