Index Trend Analysis Report
Prepared for you on Friday, May 9, 2025.
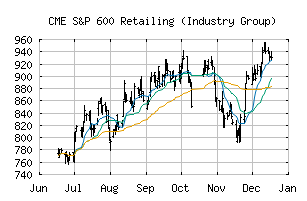
S&P 600 Retailing (Industry Group) (CME:SP600-2550)
Crossroads (+60) - SP600-2550 is struggling to move into a solid trend. Beware of choppy markets and consider a sidelines position until a stronger trend is identified.
Is it time to buy, sell, or avoid SP600-2550?
MarketClub looks at technical strength and momentum to determine if the timing is right for SP600-2550.
Learn more about the Trade Triangles and how we make technical analysis as easy as buy and sell.
|
|||||||||||||||
|
|||||||||||||||
MarketClub’s Trade Triangles for SP600-2550
![]() The long-term trend has been DOWN since Feb 21st, 2025 at 767.44
The long-term trend has been DOWN since Feb 21st, 2025 at 767.44
![]() The intermediate-term trend has been UP since May 8th, 2025 at 650.63
The intermediate-term trend has been UP since May 8th, 2025 at 650.63
![]() The short-term trend has been UP since May 1st, 2025 at 634.30
The short-term trend has been UP since May 1st, 2025 at 634.30
Smart Scan Analysis for SP600-2550
Based on our trend formula, SP600-2550 is rated as a +60 on a scale from -100 (Strong Downtrend) to +100 (Strong Uptrend).
| Open | High | Low | Price | Change |
|---|---|---|---|---|
| 645.77 | 665.76 | 645.77 | 661.34 | +22.66 |
| Prev. Close | Volume | Bid | Ask | Time |
| 661.34 | 41696486 | 2025-05-08 16:19:11 |
| 52wk High | 490.67 | 52wk High Date | 2018-08-22 |
| 52wk Low | 381.02 | 52wk Low Date | 2018-11-20 |