Index Trend Analysis Report
Prepared for you on Sunday, April 5, 2026.
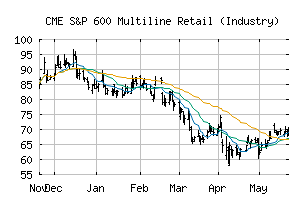
S&P 600 Multiline Retail (Industry) (CME:SP600-255030)
Bear Market Rally (-75) - SP600-255030 is showing some rallying power, but still remains in the confines of a long-term downtrend. Keep an eye on SP600-255030 as it may be in the beginning of a reversal.
Is it time to buy, sell, or avoid SP600-255030?
MarketClub looks at technical strength and momentum to determine if the timing is right for SP600-255030.
Learn more about the Trade Triangles and how we make technical analysis as easy as buy and sell.
|
|||||||||||||||
|
|||||||||||||||
MarketClub’s Trade Triangles for SP600-255030
![]() The long-term trend has been DOWN since Feb 11th, 2026 at 83.91
The long-term trend has been DOWN since Feb 11th, 2026 at 83.91
![]() The intermediate-term trend has been DOWN since Jan 27th, 2026 at 96.94
The intermediate-term trend has been DOWN since Jan 27th, 2026 at 96.94
![]() The short-term trend has been UP since Mar 31st, 2026 at 78.53
The short-term trend has been UP since Mar 31st, 2026 at 78.53
Smart Scan Analysis for SP600-255030
Based on our trend formula, SP600-255030 is rated as a -75 on a scale from -100 (Strong Downtrend) to +100 (Strong Uptrend).
| Open | High | Low | Price | Change |
|---|---|---|---|---|
| 77.35 | 81.42 | 76.84 | 80.99 | +1.96 |
| Prev. Close | Volume | Bid | Ask | Time |
| 80.99 | 5179651 | 2026-04-02 16:19:09 |
| 52wk High | 105.73 | 52wk High Date | 2018-06-12 |
| 52wk Low | 35.13 | 52wk Low Date | 2018-11-15 |