Index Trend Analysis Report
Prepared for you on Thursday, April 25, 2024.
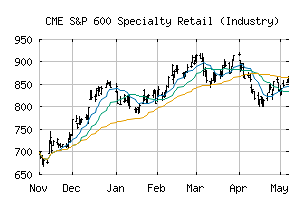
S&P 600 Specialty Retail (Industry) (CME:SP600-255040)
Sidelines Mode (+55) - SP600-255040 is moving in a sideways pattern and is unable to gain momentum in either direction. Beware of choppy movement and consider a sidelines position until a stronger trend is identified.
Is it time to buy, sell, or avoid SP600-255040?
MarketClub looks at technical strength and momentum to determine if the timing is right for SP600-255040.
Learn more about the Trade Triangles and how we make technical analysis as easy as buy and sell.
|
|||||||||||||||
|
|||||||||||||||
MarketClub’s Trade Triangles for SP600-255040
![]() The long-term trend has been UP since Dec 1st, 2023 at 746.54
The long-term trend has been UP since Dec 1st, 2023 at 746.54
![]() The intermediate-term trend has been DOWN since Apr 9th, 2024 at 862.34
The intermediate-term trend has been DOWN since Apr 9th, 2024 at 862.34
![]() The short-term trend has been UP since Apr 22nd, 2024 at 823.96
The short-term trend has been UP since Apr 22nd, 2024 at 823.96
Smart Scan Analysis for SP600-255040
Based on our trend formula, SP600-255040 is rated as a +55 on a scale from -100 (Strong Downtrend) to +100 (Strong Uptrend).
| Open | High | Low | Price | Change |
|---|---|---|---|---|
| 828.87 | 831.85 | 816.27 | 831.22 | -11.01 |
| Prev. Close | Volume | Bid | Ask | Time |
| 842.23 | 10454562 | 2024-04-25 12:12:11 |
| 52wk High | 472.61 | 52wk High Date | 2018-08-22 |
| 52wk Low | 358.05 | 52wk Low Date | 2018-02-06 |