Index Trend Analysis Report
Prepared for you on Monday, March 30, 2026.
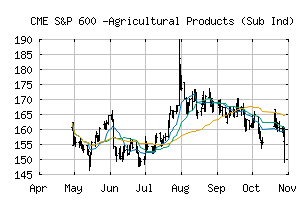
S&P 600 -Agricultural Products (Sub Ind) (CME:SP600-30202010)
Sidelines Mode (-50) - SP600-30202010 is failing to move into a strong trend and is encountering choppy trading conditions. Be cautious and consider taking a sidelines position until SP600-30202010 can gain momentum.
Is it time to buy, sell, or avoid SP600-30202010?
MarketClub looks at technical strength and momentum to determine if the timing is right for SP600-30202010.
Learn more about the Trade Triangles and how we make technical analysis as easy as buy and sell.
|
|||||||||||||||
|
|||||||||||||||
MarketClub’s Trade Triangles for SP600-30202010
![]() The long-term trend has been UP since Dec 11th, 2025 at 177.24
The long-term trend has been UP since Dec 11th, 2025 at 177.24
![]() The intermediate-term trend has been DOWN since Mar 19th, 2026 at 188.51
The intermediate-term trend has been DOWN since Mar 19th, 2026 at 188.51
![]() The short-term trend has been DOWN since Mar 27th, 2026 at 192.94
The short-term trend has been DOWN since Mar 27th, 2026 at 192.94
Smart Scan Analysis for SP600-30202010
Based on our trend formula, SP600-30202010 is rated as a -50 on a scale from -100 (Strong Downtrend) to +100 (Strong Uptrend).
| Open | High | Low | Price | Change |
|---|---|---|---|---|
| 192.75 | 197.74 | 190.75 | 195.32 | +2.19 |
| Prev. Close | Volume | Bid | Ask | Time |
| 195.32 | 303307 | 2026-03-27 16:34:14 |
| 52wk High | 137.72 | 52wk High Date | 2018-11-27 |
| 52wk Low | 100.06 | 52wk Low Date | 2017-12-15 |