Index Trend Analysis Report
Prepared for you on Saturday, February 14, 2026.
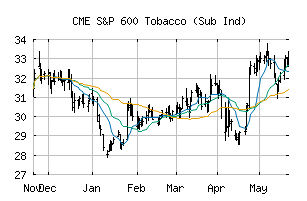
S&P 600 Tobacco (Sub Ind) (CME:SP600-30203010)
Crossroads (-60) - SP600-30203010 is struggling to move into a solid trend. Beware of choppy markets and consider a sidelines position until a stronger trend is identified.
Is it time to buy, sell, or avoid SP600-30203010?
MarketClub looks at technical strength and momentum to determine if the timing is right for SP600-30203010.
Learn more about the Trade Triangles and how we make technical analysis as easy as buy and sell.
|
|||||||||||||||
|
|||||||||||||||
MarketClub’s Trade Triangles for SP600-30203010
![]() The long-term trend has been UP since Jan 30th, 2026 at 31.84
The long-term trend has been UP since Jan 30th, 2026 at 31.84
![]() The intermediate-term trend has been DOWN since Feb 9th, 2026 at 30.28
The intermediate-term trend has been DOWN since Feb 9th, 2026 at 30.28
![]() The short-term trend has been DOWN since Feb 9th, 2026 at 32.64
The short-term trend has been DOWN since Feb 9th, 2026 at 32.64
Smart Scan Analysis for SP600-30203010
Based on our trend formula, SP600-30203010 is rated as a -60 on a scale from -100 (Strong Downtrend) to +100 (Strong Uptrend).
| Open | High | Low | Price | Change |
|---|---|---|---|---|
| 29.92 | 30.22 | 29.71 | 30.18 | +0.40 |
| Prev. Close | Volume | Bid | Ask | Time |
| 30.18 | 194768 | 2026-02-13 16:19:41 |
| 52wk High | 26.68 | 52wk High Date | 2018-11-09 |
| 52wk Low | 15.96 | 52wk Low Date | 2018-02-06 |