Index Trend Analysis Report
Prepared for you on Thursday, December 26, 2024.
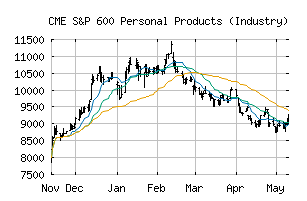
S&P 600 Personal Products (Industry) (CME:SP600-303020)
Sidelines Mode (+55) - SP600-303020 is moving in a sideways pattern and is unable to gain momentum in either direction. Beware of choppy movement and consider a sidelines position until a stronger trend is identified.
Is it time to buy, sell, or avoid SP600-303020?
MarketClub looks at technical strength and momentum to determine if the timing is right for SP600-303020.
Learn more about the Trade Triangles and how we make technical analysis as easy as buy and sell.
|
|||||||||||||||
|
|||||||||||||||
MarketClub’s Trade Triangles for SP600-303020
![]() The long-term trend has been UP since Dec 2nd, 2024 at 8909.96
The long-term trend has been UP since Dec 2nd, 2024 at 8909.96
![]() The intermediate-term trend has been DOWN since Dec 16th, 2024 at 8497.43
The intermediate-term trend has been DOWN since Dec 16th, 2024 at 8497.43
![]() The short-term trend has been UP since Dec 24th, 2024 at 8285.26
The short-term trend has been UP since Dec 24th, 2024 at 8285.26
Smart Scan Analysis for SP600-303020
Based on our trend formula, SP600-303020 is rated as a +55 on a scale from -100 (Strong Downtrend) to +100 (Strong Uptrend).
| Open | High | Low | Price | Change |
|---|---|---|---|---|
| 8108.42 | 8311.33 | 8077.48 | 8311.33 | +206.51 |
| Prev. Close | Volume | Bid | Ask | Time |
| 8311.33 | 289645 | 2024-12-24 13:19:56 |
| 52wk High | 5291.09 | 52wk High Date | 2018-09-13 |
| 52wk Low | 2656.54 | 52wk Low Date | 2018-03-01 |