Index Trend Analysis Report
Prepared for you on Wednesday, March 12, 2025.
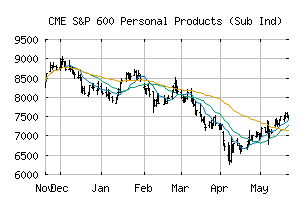
S&P 600 Personal Products (Sub Ind) (CME:SP600-30302010)
Bear Market Rally (-75) - SP600-30302010 is showing some rallying power, but still remains in the confines of a long-term downtrend. Keep an eye on SP600-30302010 as it may be in the beginning of a reversal.
Is it time to buy, sell, or avoid SP600-30302010?
MarketClub looks at technical strength and momentum to determine if the timing is right for SP600-30302010.
Learn more about the Trade Triangles and how we make technical analysis as easy as buy and sell.
|
|||||||||||||||
|
|||||||||||||||
MarketClub’s Trade Triangles for SP600-30302010
![]() The long-term trend has been DOWN since Feb 10th, 2025 at 7840.38
The long-term trend has been DOWN since Feb 10th, 2025 at 7840.38
![]() The intermediate-term trend has been UP since Feb 26th, 2025 at 8354.15
The intermediate-term trend has been UP since Feb 26th, 2025 at 8354.15
![]() The short-term trend has been DOWN since Mar 10th, 2025 at 7885.90
The short-term trend has been DOWN since Mar 10th, 2025 at 7885.90
Smart Scan Analysis for SP600-30302010
Based on our trend formula, SP600-30302010 is rated as a -75 on a scale from -100 (Strong Downtrend) to +100 (Strong Uptrend).
| Open | High | Low | Price | Change |
|---|---|---|---|---|
| 7885.58 | 7994.80 | 7840.16 | 7911.91 | +20.09 |
| Prev. Close | Volume | Bid | Ask | Time |
| 7911.91 | 1096366 | 2025-03-11 16:20:11 |
| 52wk High | 5291.09 | 52wk High Date | 2018-09-13 |
| 52wk Low | 2656.54 | 52wk Low Date | 2018-03-01 |