Index Trend Analysis Report
Prepared for you on Tuesday, March 17, 2026.
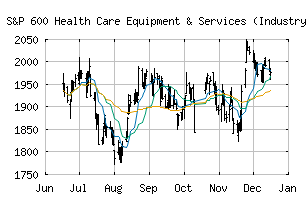
S&P 600 Health Care Equipment & Services (Industry Group) (CME:SP600-3510)
Bear Market Rally (-75) - SP600-3510 is showing some rallying power, but still remains in the confines of a long-term downtrend. Keep an eye on SP600-3510 as it may be in the beginning of a reversal.
Is it time to buy, sell, or avoid SP600-3510?
MarketClub looks at technical strength and momentum to determine if the timing is right for SP600-3510.
Learn more about the Trade Triangles and how we make technical analysis as easy as buy and sell.
|
|||||||||||||||
|
|||||||||||||||
MarketClub’s Trade Triangles for SP600-3510
![]() The long-term trend has been DOWN since Mar 9th, 2026 at 1825.86
The long-term trend has been DOWN since Mar 9th, 2026 at 1825.86
![]() The intermediate-term trend has been DOWN since Mar 9th, 2026 at 1847.38
The intermediate-term trend has been DOWN since Mar 9th, 2026 at 1847.38
![]() The short-term trend has been UP since Mar 17th, 2026 at 1816.44
The short-term trend has been UP since Mar 17th, 2026 at 1816.44
Smart Scan Analysis for SP600-3510
Based on our trend formula, SP600-3510 is rated as a -75 on a scale from -100 (Strong Downtrend) to +100 (Strong Uptrend).
| Open | High | Low | Price | Change |
|---|---|---|---|---|
| 1810.04 | 1829.78 | 1808.64 | 1829.78 | +36.73 |
| Prev. Close | Volume | Bid | Ask | Time |
| 1793.05 | 1451540 | 2026-03-17 09:40:41 |
| 52wk High | 2208.7 | 52wk High Date | 2018-09-07 |
| 52wk Low | 1491.57 | 52wk Low Date | 2017-12-01 |