Index Trend Analysis Report
Prepared for you on Friday, January 23, 2026.
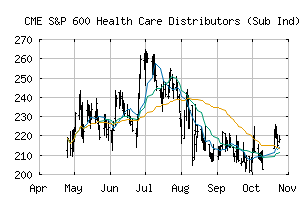
S&P 600 Health Care Distributors (Sub Ind) (CME:SP600-35102010)
Bull Market Weakness (+75) - SP600-35102010 is showing signs of short-term weakness, but still remains in the confines of a long-term uptrend. Keep an eye on SP600-35102010 as it may be in the beginning stages of a reversal.
Is it time to buy, sell, or avoid SP600-35102010?
MarketClub looks at technical strength and momentum to determine if the timing is right for SP600-35102010.
Learn more about the Trade Triangles and how we make technical analysis as easy as buy and sell.
|
|||||||||||||||
|
|||||||||||||||
MarketClub’s Trade Triangles for SP600-35102010
![]() The long-term trend has been UP since Nov 4th, 2025 at 243.82
The long-term trend has been UP since Nov 4th, 2025 at 243.82
![]() The intermediate-term trend has been UP since Jan 8th, 2026 at 247.26
The intermediate-term trend has been UP since Jan 8th, 2026 at 247.26
![]() The short-term trend has been DOWN since Jan 20th, 2026 at 242.36
The short-term trend has been DOWN since Jan 20th, 2026 at 242.36
Smart Scan Analysis for SP600-35102010
Based on our trend formula, SP600-35102010 is rated as a +75 on a scale from -100 (Strong Downtrend) to +100 (Strong Uptrend).
| Open | High | Low | Price | Change |
|---|---|---|---|---|
| 246.79 | 253.32 | 244.46 | 244.69 | -0.47 |
| Prev. Close | Volume | Bid | Ask | Time |
| 244.69 | 999490 | 2026-01-22 16:20:11 |
| 52wk High | 717.24 | 52wk High Date | 2018-01-29 |
| 52wk Low | 172.68 | 52wk Low Date | 2018-11-27 |