Index Trend Analysis Report
Prepared for you on Thursday, April 25, 2024.
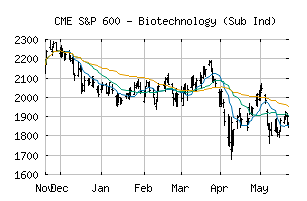
S&P 600 - Biotechnology (Sub Ind) (CME:SP600-35201010)
Strong Downtrend (-100) - SP600-35201010 is in a strong downtrend that is likely to continue. With short-term, intermediate, and long-term bearish momentum, SP600-35201010 continues to fall. Traders should use caution and set stops.
Is it time to buy, sell, or avoid SP600-35201010?
MarketClub looks at technical strength and momentum to determine if the timing is right for SP600-35201010.
Learn more about the Trade Triangles and how we make technical analysis as easy as buy and sell.
|
|||||||||||||||
|
|||||||||||||||
MarketClub’s Trade Triangles for SP600-35201010
![]() The long-term trend has been DOWN since Apr 2nd, 2024 at 2112.01
The long-term trend has been DOWN since Apr 2nd, 2024 at 2112.01
![]() The intermediate-term trend has been DOWN since Mar 5th, 2024 at 2226.23
The intermediate-term trend has been DOWN since Mar 5th, 2024 at 2226.23
![]() The short-term trend has been DOWN since Apr 25th, 2024 at 1869.50
The short-term trend has been DOWN since Apr 25th, 2024 at 1869.50
Smart Scan Analysis for SP600-35201010
Based on our trend formula, SP600-35201010 is rated as a -100 on a scale from -100 (Strong Downtrend) to +100 (Strong Uptrend).
| Open | High | Low | Price | Change |
|---|---|---|---|---|
| 1896.75 | 1896.75 | 1861.86 | 1876.06 | -38.77 |
| Prev. Close | Volume | Bid | Ask | Time |
| 1914.83 | 2291114 | 2024-04-25 11:54:11 |
| 52wk High | 2748.33 | 52wk High Date | 2018-08-30 |
| 52wk Low | 1757.41 | 52wk Low Date | 2017-12-06 |