Index Trend Analysis Report
Prepared for you on Friday, May 9, 2025.
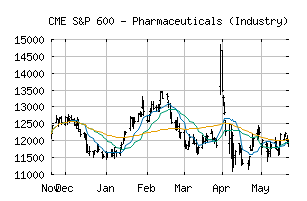
S&P 600 - Pharmaceuticals (Industry) (CME:SP600-352020)
Weak Downtrend (-65) - SP600-352020 is showing signs of a strengthening downtrend. Monitor SP600-352020 as it may be building momentum to the downside.
Is it time to buy, sell, or avoid SP600-352020?
MarketClub looks at technical strength and momentum to determine if the timing is right for SP600-352020.
Learn more about the Trade Triangles and how we make technical analysis as easy as buy and sell.
|
|||||||||||||||
|
|||||||||||||||
MarketClub’s Trade Triangles for SP600-352020
![]() The long-term trend has been DOWN since Apr 9th, 2025 at 11452.55
The long-term trend has been DOWN since Apr 9th, 2025 at 11452.55
![]() The intermediate-term trend has been DOWN since Apr 7th, 2025 at 11756.61
The intermediate-term trend has been DOWN since Apr 7th, 2025 at 11756.61
![]() The short-term trend has been UP since May 8th, 2025 at 11936.19
The short-term trend has been UP since May 8th, 2025 at 11936.19
Smart Scan Analysis for SP600-352020
Based on our trend formula, SP600-352020 is rated as a -65 on a scale from -100 (Strong Downtrend) to +100 (Strong Uptrend).
| Open | High | Low | Price | Change |
|---|---|---|---|---|
| 11696.15 | 11943.98 | 11542.65 | 11873.58 | +245.96 |
| Prev. Close | Volume | Bid | Ask | Time |
| 11873.58 | 12128263 | 2025-05-08 16:19:11 |
| 52wk High | 16471.8 | 52wk High Date | 2018-08-08 |
| 52wk Low | 9596.47 | 52wk Low Date | 2017-12-06 |