Index Trend Analysis Report
Prepared for you on Friday, April 19, 2024.
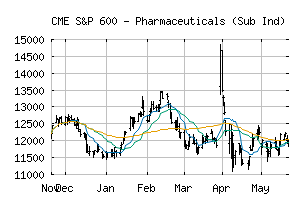
S&P 600 - Pharmaceuticals (Sub Ind) (CME:SP600-35202010)
Weak Downtrend (-65) - SP600-35202010 is showing signs of a strengthening downtrend. Monitor SP600-35202010 as it may be building momentum to the downside.
Is it time to buy, sell, or avoid SP600-35202010?
MarketClub looks at technical strength and momentum to determine if the timing is right for SP600-35202010.
Learn more about the Trade Triangles and how we make technical analysis as easy as buy and sell.
|
|||||||||||||||
|
|||||||||||||||
MarketClub’s Trade Triangles for SP600-35202010
![]() The long-term trend has been UP since Feb 15th, 2024 at 10529.89
The long-term trend has been UP since Feb 15th, 2024 at 10529.89
![]() The intermediate-term trend has been DOWN since Apr 3rd, 2024 at 10545.87
The intermediate-term trend has been DOWN since Apr 3rd, 2024 at 10545.87
![]() The short-term trend has been DOWN since Apr 2nd, 2024 at 10684.47
The short-term trend has been DOWN since Apr 2nd, 2024 at 10684.47
Smart Scan Analysis for SP600-35202010
Based on our trend formula, SP600-35202010 is rated as a -70 on a scale from -100 (Strong Downtrend) to +100 (Strong Uptrend).
| Open | High | Low | Price | Change |
|---|---|---|---|---|
| 9979.22 | 10086.06 | 9977.92 | 10009.71 | +6.44 |
| Prev. Close | Volume | Bid | Ask | Time |
| 10003.27 | 4283987 | 2024-04-19 14:39:26 |
| 52wk High | 16471.8 | 52wk High Date | 2018-08-08 |
| 52wk Low | 9596.47 | 52wk Low Date | 2017-12-06 |