Index Trend Analysis Report
Prepared for you on Friday, May 9, 2025.
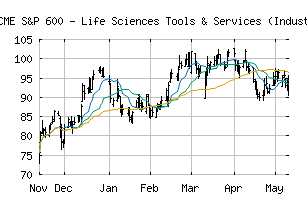
S&P 600 - Life Sciences Tools & Services (Industry) (CME:SP600-352030)
Bear Market Rally (-75) - SP600-352030 is showing some rallying power, but still remains in the confines of a long-term downtrend. Keep an eye on SP600-352030 as it may be in the beginning of a reversal.
Is it time to buy, sell, or avoid SP600-352030?
MarketClub looks at technical strength and momentum to determine if the timing is right for SP600-352030.
Learn more about the Trade Triangles and how we make technical analysis as easy as buy and sell.
|
|||||||||||||||
|
|||||||||||||||
MarketClub’s Trade Triangles for SP600-352030
![]() The long-term trend has been DOWN since May 13th, 2024 at 84.45
The long-term trend has been DOWN since May 13th, 2024 at 84.45
![]() The intermediate-term trend has been DOWN since Jan 15th, 2025 at 75.06
The intermediate-term trend has been DOWN since Jan 15th, 2025 at 75.06
![]() The short-term trend has been DOWN since May 6th, 2025 at 42.98
The short-term trend has been DOWN since May 6th, 2025 at 42.98
Smart Scan Analysis for SP600-352030
Based on our trend formula, SP600-352030 is rated as a -80 on a scale from -100 (Strong Downtrend) to +100 (Strong Uptrend).
| Open | High | Low | Price | Change |
|---|---|---|---|---|
| 42.71 | 44.94 | 42.08 | 44.37 | +2.56 |
| Prev. Close | Volume | Bid | Ask | Time |
| 44.37 | 7762988 | 2025-05-08 16:19:11 |
| 52wk High | 419.53 | 52wk High Date | 2018-08-02 |
| 52wk Low | 273.07 | 52wk Low Date | 2017-12-27 |