Index Trend Analysis Report
Prepared for you on Wednesday, July 30, 2025.
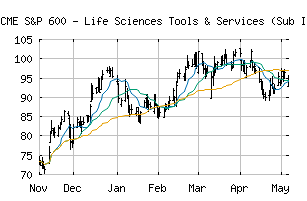
S&P 600 - Life Sciences Tools & Services (Sub Ind) (CME:SP600-35203010)
Sidelines Mode (-55) - SP600-35203010 is moving in a sideways pattern and is unable to gain momentum in either direction. Beware of choppy movement and consider a sidelines position until a stronger trend is identified.
Is it time to buy, sell, or avoid SP600-35203010?
MarketClub looks at technical strength and momentum to determine if the timing is right for SP600-35203010.
Learn more about the Trade Triangles and how we make technical analysis as easy as buy and sell.
|
|||||||||||||||
|
|||||||||||||||
MarketClub’s Trade Triangles for SP600-35203010
![]() The long-term trend has been DOWN since May 13th, 2024 at 84.45
The long-term trend has been DOWN since May 13th, 2024 at 84.45
![]() The intermediate-term trend has been UP since Jul 24th, 2025 at 45.68
The intermediate-term trend has been UP since Jul 24th, 2025 at 45.68
![]() The short-term trend has been DOWN since Jul 30th, 2025 at 43.87
The short-term trend has been DOWN since Jul 30th, 2025 at 43.87
Smart Scan Analysis for SP600-35203010
Based on our trend formula, SP600-35203010 is rated as a -55 on a scale from -100 (Strong Downtrend) to +100 (Strong Uptrend).
| Open | High | Low | Price | Change |
|---|---|---|---|---|
| 45.19 | 45.44 | 43.61 | 44.18 | -0.50 |
| Prev. Close | Volume | Bid | Ask | Time |
| 44.68 | 3270477 | 2025-07-30 16:20:11 |
| 52wk High | 419.53 | 52wk High Date | 2018-08-02 |
| 52wk Low | 273.07 | 52wk Low Date | 2017-12-27 |