Index Trend Analysis Report
Prepared for you on Sunday, April 5, 2026.
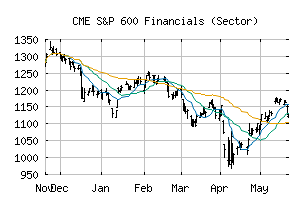
S&P 600 Financials (Sector) (CME:SP600-40)
Bull Market Weakness (+75) - SP600-40 is showing signs of short-term weakness, but still remains in the confines of a long-term uptrend. Keep an eye on SP600-40 as it may be in the beginning stages of a reversal.
Is it time to buy, sell, or avoid SP600-40?
MarketClub looks at technical strength and momentum to determine if the timing is right for SP600-40.
Learn more about the Trade Triangles and how we make technical analysis as easy as buy and sell.
|
|||||||||||||||
|
|||||||||||||||
MarketClub’s Trade Triangles for SP600-40
![]() The long-term trend has been DOWN since Mar 9th, 2026 at 1224.19
The long-term trend has been DOWN since Mar 9th, 2026 at 1224.19
![]() The intermediate-term trend has been UP since Apr 1st, 2026 at 1256.92
The intermediate-term trend has been UP since Apr 1st, 2026 at 1256.92
![]() The short-term trend has been UP since Mar 31st, 2026 at 1241.98
The short-term trend has been UP since Mar 31st, 2026 at 1241.98
Smart Scan Analysis for SP600-40
Based on our trend formula, SP600-40 is rated as a +70 on a scale from -100 (Strong Downtrend) to +100 (Strong Uptrend).
| Open | High | Low | Price | Change |
|---|---|---|---|---|
| 1229.67 | 1253.33 | 1224.27 | 1252.95 | +6.58 |
| Prev. Close | Volume | Bid | Ask | Time |
| 1252.95 | 93960186 | 2026-04-02 16:19:14 |
| 52wk High | 1172.16 | 52wk High Date | 2018-08-21 |
| 52wk Low | 978.03 | 52wk Low Date | 2018-10-25 |