Index Trend Analysis Report
Prepared for you on Thursday, December 26, 2024.
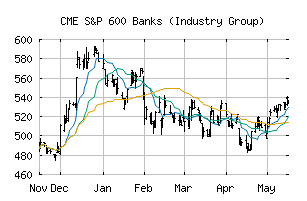
S&P 600 Banks (Industry Group) (CME:SP600-4010)
Crossroads (-60) - SP600-4010 is struggling to move into a solid trend. Beware of choppy markets and consider a sidelines position until a stronger trend is identified.
Is it time to buy, sell, or avoid SP600-4010?
MarketClub looks at technical strength and momentum to determine if the timing is right for SP600-4010.
Learn more about the Trade Triangles and how we make technical analysis as easy as buy and sell.
|
|||||||||||||||
|
|||||||||||||||
MarketClub’s Trade Triangles for SP600-4010
![]() The long-term trend has been UP since Jul 11th, 2024 at 542.44
The long-term trend has been UP since Jul 11th, 2024 at 542.44
![]() The intermediate-term trend has been DOWN since Dec 17th, 2024 at 684.16
The intermediate-term trend has been DOWN since Dec 17th, 2024 at 684.16
![]() The short-term trend has been DOWN since Nov 29th, 2024 at 718.64
The short-term trend has been DOWN since Nov 29th, 2024 at 718.64
Smart Scan Analysis for SP600-4010
Based on our trend formula, SP600-4010 is rated as a -60 on a scale from -100 (Strong Downtrend) to +100 (Strong Uptrend).
| Open | High | Low | Price | Change |
|---|---|---|---|---|
| 645.79 | 650.50 | 642.27 | 650.50 | +5.36 |
| Prev. Close | Volume | Bid | Ask | Time |
| 650.50 | 8982809 | 2024-12-24 13:19:56 |
| 52wk High | 641.52 | 52wk High Date | 2018-06-07 |
| 52wk Low | 513.34 | 52wk Low Date | 2018-10-24 |