Index Trend Analysis Report
Prepared for you on Thursday, March 26, 2026.
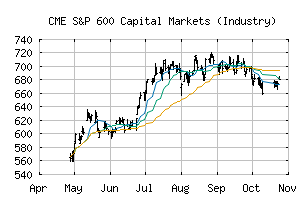
S&P 600 Capital Markets (Industry) (CME:SP600-402030)
Bear Market Rally (-75) - SP600-402030 is showing some rallying power, but still remains in the confines of a long-term downtrend. Keep an eye on SP600-402030 as it may be in the beginning of a reversal.
Is it time to buy, sell, or avoid SP600-402030?
MarketClub looks at technical strength and momentum to determine if the timing is right for SP600-402030.
Learn more about the Trade Triangles and how we make technical analysis as easy as buy and sell.
|
|||||||||||||||
|
|||||||||||||||
MarketClub’s Trade Triangles for SP600-402030
![]() The long-term trend has been DOWN since Mar 9th, 2026 at 629.87
The long-term trend has been DOWN since Mar 9th, 2026 at 629.87
![]() The intermediate-term trend has been DOWN since Feb 3rd, 2026 at 688.67
The intermediate-term trend has been DOWN since Feb 3rd, 2026 at 688.67
![]() The short-term trend has been UP since Mar 23rd, 2026 at 629.96
The short-term trend has been UP since Mar 23rd, 2026 at 629.96
Smart Scan Analysis for SP600-402030
Based on our trend formula, SP600-402030 is rated as a -75 on a scale from -100 (Strong Downtrend) to +100 (Strong Uptrend).
| Open | High | Low | Price | Change |
|---|---|---|---|---|
| 636.01 | 641.88 | 626.17 | 636.45 | +10.35 |
| Prev. Close | Volume | Bid | Ask | Time |
| 636.45 | 14140164 | 2026-03-25 16:19:26 |
| 52wk High | 357.94 | 52wk High Date | 2017-12-06 |
| 52wk Low | 281.36 | 52wk Low Date | 2018-04-04 |