Index Trend Analysis Report
Prepared for you on Friday, December 5, 2025.
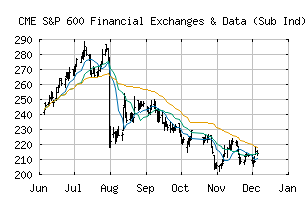
S&P 600 Financial Exchanges & Data (Sub Ind) (CME:SP600-40203040)
Countertrend Down (-85) - SP600-40203040 is showing short-term strength. However, look for the longer-term bearish trend to resume. As always, continue to monitor the trend score and set stops.
Is it time to buy, sell, or avoid SP600-40203040?
MarketClub looks at technical strength and momentum to determine if the timing is right for SP600-40203040.
Learn more about the Trade Triangles and how we make technical analysis as easy as buy and sell.
|
|||||||||||||||
|
|||||||||||||||
MarketClub’s Trade Triangles for SP600-40203040
![]() The long-term trend has been DOWN since Oct 6th, 2025 at 217.70
The long-term trend has been DOWN since Oct 6th, 2025 at 217.70
![]() The intermediate-term trend has been DOWN since Jul 31st, 2025 at 264.43
The intermediate-term trend has been DOWN since Jul 31st, 2025 at 264.43
![]() The short-term trend has been UP since Dec 4th, 2025 at 213.24
The short-term trend has been UP since Dec 4th, 2025 at 213.24
Smart Scan Analysis for SP600-40203040
Based on our trend formula, SP600-40203040 is rated as a -85 on a scale from -100 (Strong Downtrend) to +100 (Strong Uptrend).
| Open | High | Low | Price | Change |
|---|---|---|---|---|
| 215.44 | 215.92 | 212.75 | 213.85 | -1.36 |
| Prev. Close | Volume | Bid | Ask | Time |
| 215.21 | 806615 | 2025-12-05 16:19:54 |