Index Trend Analysis Report
Prepared for you on Monday, January 26, 2026.
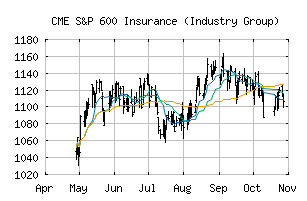
S&P 600 Insurance (Industry Group) (CME:SP600-4030)
Crossroads (-60) - SP600-4030 is struggling to move into a solid trend. Beware of choppy markets and consider a sidelines position until a stronger trend is identified.
Is it time to buy, sell, or avoid SP600-4030?
MarketClub looks at technical strength and momentum to determine if the timing is right for SP600-4030.
Learn more about the Trade Triangles and how we make technical analysis as easy as buy and sell.
|
|||||||||||||||
|
|||||||||||||||
MarketClub’s Trade Triangles for SP600-4030
![]() The long-term trend has been UP since Dec 1st, 2023 at 783.16
The long-term trend has been UP since Dec 1st, 2023 at 783.16
![]() The intermediate-term trend has been DOWN since Jan 5th, 2026 at 1175.60
The intermediate-term trend has been DOWN since Jan 5th, 2026 at 1175.60
![]() The short-term trend has been DOWN since Dec 26th, 2025 at 1207.31
The short-term trend has been DOWN since Dec 26th, 2025 at 1207.31
Smart Scan Analysis for SP600-4030
Based on our trend formula, SP600-4030 is rated as a -60 on a scale from -100 (Strong Downtrend) to +100 (Strong Uptrend).
| Open | High | Low | Price | Change |
|---|---|---|---|---|
| 1099.16 | 1117.96 | 1099.16 | 1104.63 | +8.42 |
| Prev. Close | Volume | Bid | Ask | Time |
| 1096.21 | 1741572 | 2026-01-26 11:32:56 |
| 52wk High | 930.93 | 52wk High Date | 2018-09-14 |
| 52wk Low | 764.77 | 52wk Low Date | 2018-02-09 |