Index Trend Analysis Report
Prepared for you on Wednesday, July 30, 2025.
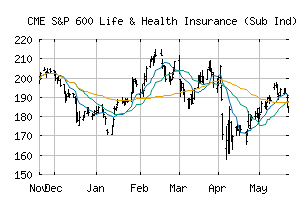
S&P 600 Life & Health Insurance (Sub Ind) (CME:SP600-40301020)
Long-Term Uptrend (+90) - SP600-40301020 is in a strong uptrend that is likely to continue. While SP600-40301020 is showing intraday weakness, it remains in the confines of a bullish trend. Traders should use caution and utilize a stop order.
Is it time to buy, sell, or avoid SP600-40301020?
MarketClub looks at technical strength and momentum to determine if the timing is right for SP600-40301020.
Learn more about the Trade Triangles and how we make technical analysis as easy as buy and sell.
|
|||||||||||||||
|
|||||||||||||||
MarketClub’s Trade Triangles for SP600-40301020
![]() The long-term trend has been UP since Jul 29th, 2025 at 206.50
The long-term trend has been UP since Jul 29th, 2025 at 206.50
![]() The intermediate-term trend has been UP since May 2nd, 2025 at 185.50
The intermediate-term trend has been UP since May 2nd, 2025 at 185.50
![]() The short-term trend has been UP since Jul 17th, 2025 at 196.79
The short-term trend has been UP since Jul 17th, 2025 at 196.79
Smart Scan Analysis for SP600-40301020
Based on our trend formula, SP600-40301020 is rated as a +90 on a scale from -100 (Strong Downtrend) to +100 (Strong Uptrend).
| Open | High | Low | Price | Change |
|---|---|---|---|---|
| 206.08 | 207.14 | 203.25 | 203.58 | -1.11 |
| Prev. Close | Volume | Bid | Ask | Time |
| 203.58 | 10574603 | 2025-07-29 16:17:39 |
| 52wk High | 165.52 | 52wk High Date | 2018-08-07 |
| 52wk Low | 116.14 | 52wk Low Date | 2018-05-03 |